
Process
Designs
Tools
Case Studies
Regression Discontinuity Design (RDD)
January 10, 2022, Evaluation Observatory

Consider a food subsidy programme that aims to improve the food security of families within a given population. However, before launching the program comprehensively, the organization would like to test their initial hypothesis: i.e. that food subsidies can substantially enhance the food security of Below Poverty Line (BPL) families, ensuring two conditions:
- That, food subsidies are given to families who truly need it.
- And, causal impacts are deduced, to supplement the other programs run by the organization.
While an experimental Randomized Control Trial is an excellent option to deduce causation; however, random selection mandated by RCTs will fail to ensure that food subsidies are administered to the relevant population. Neither are other quasi-experimental designs suitable, given that they do not specifically cater to the selection of beneficiaries by design.
What would be an appropriate evaluation design for the programme in such a situation?
A Regression Discontinuity Design would work as an excellent competitor to an RCT. By design, an RDD can determine program eligibility based on a cut off criterion of a poverty score (which is a continuous variable). Outcome indicators can then be measured pr and post-test to determine causation.
What is Regression Discontinuity Design?
Typically done in a pre-test – post test model1, a Regression Discontinuity Design (RDD) is a quasi-experimental evaluation method used to evaluate programs which have a clear cut off point based on an eligibility index (which is a continuous variable2). The evaluation design allows the comparison of indicators in a given sample population immediately above and below the cut-off point to identify the impact of the program on a given outcome.1 The same can be understood through the diagram below:
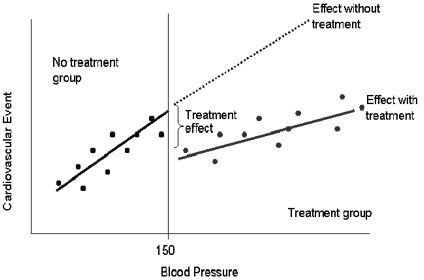
Figure 1: Sample Visualisation of Regression Discontinuity Analysis Source: (Tsai et al., 2016)
But, why not use an experimental design?
An RDD is considered a strong competitor to Randomized Control Trials in determining causation. RCTS can be costly and time-consuming evaluation designs, whereas regression discontinuity is comparatively cost-effective and less time consuming. Also, due to the randomized nature of assignment, an RDD may neglect needy program beneficiaries in the assignment process, denying them aid. Further, while implementing RCTs, it can sometimes be tricky to administer interventions without contamination worries; however, fuzzy RDD (see below) help account for such errors.
What conditions need to be fulfilled for the application of a regression discontinuity design?
- There is a continuous eligibility index on which the population of interest is ranked.
- There is a clearly defined cut-off point used to determine the eligible population for the program.
What are the assumptions of Regression Discontinuity Design?
- The eligibility index should be continuous around the cut-off point to prevent individuals from manipulating their eligibility index to increase their chances of being included in or excluded from the program.
- Individuals close to the cut-off point should be similar in observed and unobserved characteristics.
The assignment rule—the way people are assigned or selected into the program can be either deterministic or probabilistic. Based on this, RDD can be of two types,
- Sharp Design: In this design, treatment is assigned according to a discrete cut-off point where all eligible receiving the treatment and all ineligible do not receive it. Effect of the treatment is calculated using simple comparison of means.
- Fuzzy Design: This design is often utilized in practice, when due to administrative over-rides or self-selection errors, there is an imperfect compliance of the assignment rule. Some eligible beneficiaries may fail to receive treatment; while those who are ineligible receive it. In order to calculate the effect of the treatment, one has to calculate outcome discontinuity (derived from regressing outcome indicators) and divide it with treatment discontinuity (regressing observable indicators on the treatment group) .
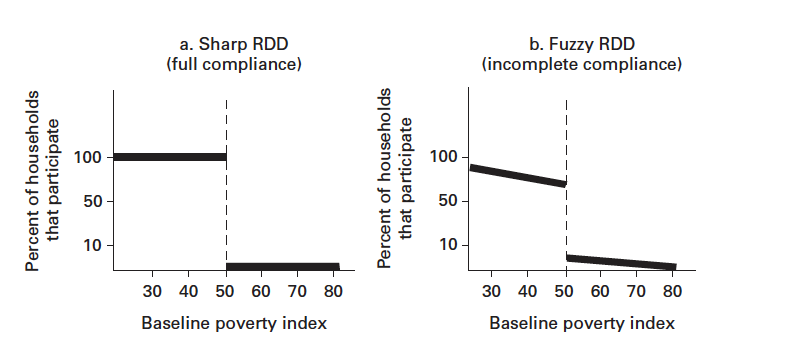
Figure 2: Fuzzy vs Sharp RDD Visualizations (DIME Wiki, 2019)
List of recommended resources:
For a broad overview
-
Published by World Bank, this blog post gives a brief overview of the RDD. It also explains conditions, assumptions and types of designs of RDD and discusses the methods of treatment effect estimation.

-
Written by Kultar Singh, Dharmendra Chandurkar and Varun Dutt, Chapter 6.2.3 (Page 79) of the book explains the RDD concept in simple and lucid language with the help of illustrations.
-
Published by CAF, this web post explains the importance of RDD while evaluating public programs. It discusses the components, requirements, and processes of RDD with the help of examples.
-
Zijing Zhu’s article provides practitioners with a basic overview of the concept and discusses various applications and caveats of RDD.
-
Published by conjoint.ly, this post introduces RDDs and discusses the basic design, the logic of the design and its ethics with the help of graphs.

-
Developed by EU Science Hub, the video highlights the significance of RDD as a powerful ‘Counterfactual Impact Evaluation’ method, using evaluations of a program to support the job search of unemployed workers.
For in depth understanding

-
Developed by World Bank, chapter 6 of the book discusses the concept of RDD and its various types, with the help of case studies. It also discusses the limitations and interpretations of the RDD method.
-
Published by MDRC, this guide provides an in-depth perspective on the Regression Discontinuity approach and covers topics like graphical presentation in analysis, estimation, establishing the interval validity, precision of estimates, generalizability of findings, etc. It also provides practitioners with the widely used nomenclature, and steps followed when implementing an RDD.
-
Published by Cambridge University Press, this document provides an accessible and practical guide for analyzing and interpreting the results obtained from Regression Discontinuity Designs. The author also discusses Sharp RD design and aspects like empirical and conceptual extensions to the basic RDD setup.
Case Study
-
This case study evaluates the impact of the Gambian hardship allowance, which provides a salary premium of 30-40% to primary school teachers in remote locations, based on the distribution and characteristics of teachers across schools, using RDD.
-
This paper provides the first impact evaluation of the Medical Assistance Program based on data from June 2006 to December 2006 and presents important findings based on a Regression Discontinuity Design analysis.
Toolkits

-
Developed by Joe Waddington ( PhD Regression Discontinuity), This video demonstrates the use of Stata to evaluate the effect of class size on student reading scores using RDD.
-
Developed by Shiro Kuriwaki, part I of this video guides practitioners to visualize RDD while part II estimates RD coefficients using R. Also highly recommended are Andrew Heiss’s informative and student friendly tutorials on using R for RDD, which can be viewed here.
Further Reading
-
Written by Hyunshik Lee and Tom Munk, this article discusses the concept of RDD with special attention to discussing ways of amending the violations made to assumptions under which parametric regression models are implemented. It also explains introduces RDD designs, power analysis, sample size estimation, and issues in the application of RDD designs and their solutions.
You may also like

Opinions
Big Data: An Introduction and Application in the Social Sector
August 30, 2021

Events
Building an Evaluation Ecosystem: Perspectives from Evaluation Associations - Key Takeaways from the Webinars
August 30, 2021

Themes
GENSA Celebrates One Year, and Keynote by Katherine Hay
August 30, 2021